- Overview
- General Strategy
- Import required libraries
- Read in the dataset
- Partition data columns into input and output
- Partition data rows into training and testing data
- Scale the input data
- Pick the model type
- Train the model on the training data
- Test the "trained" model on the testing data
- Print reports on how well it worked
- Tools and Libraries
- References
Overview
Data organized as a table of columns and rows; like a spreadsheet. The rows are data points (or observations or measurements) and the columns are property values. The columns are partitioned into input columns and output columns. This is arbitrary, but the input is typically what you will be given from a measurement, and the output is what you will like to predict. The input values (one for each column in a row) can be:
- discrete - such as integers or classes (or categories) like {'bird', 'dog', 'cat'} (e.g. multiclass classification) or {'yes', 'no'} or {0, 1} (e.g. binary classification)). The elements in a class are often called labels; e.g. the "bird" label.
- continuous - such as real numbers.
Some data, like photos, can be a multilabel classification; e.g. this picture contains "mom" and "dad".
If the output:
- Is a single continuous value (e.g. a real number), then it is called scalar regression.
- Has multiple continuous values (e.g. a vector or 3D coordinate), then it is called vector regression.
A batch of rows is a subset of rows that are processed together for efficiency. For example, if you have 1024 rows of data, you might partition them into 8 batches of 128 records so that they can efficiently be loaded into a GPU. Batch sizes are typically a power of two.
A model is a function that takes an input and returns an output. $f(x) = x^2$ is a trivial model that takes one real input value and returns a real output value. In school, you are taught to take the input (-3, -2, -1, 0, 1, 2, 3, ...) and generate the output (9, 4, 1, 0, 1, 4, 9) from the given model. But in science, nature (through experimentation) produces the input and the output, and you are supposed to find a model that best fits the data; i.e. minimizes the cost or the prediction. For example, you might observe a baseball being thrown up as an input velocity, and record the height of the baseball at various times t. Later, you might surmise that the formula for the height at time t is $h(t) = -16t^2 + vt + h_0$. This is the standard formula derived from laws of physics, but how well does it fit the observed data, which contains measurement errors, and is subject to air friction, humidity, altitude, and wind? The model does not take these additional parameters into account so we would expect some errors in the predicted output from the actual data (or target output or ground-truth or annotations). We can measure how well this model predicts the output from the input as follows:
- Partition the data into two random sets where 80% is called the training data and 20% is called testing data.
- Pick a model; e.g. a neural network, or linear regression.
- Use one of many different algorithms to train the model to get the parameters. This takes some processing time. Training consists of iterating (or passing) through the data many times and updating the model to make it iteratively better each pass until some good enough score is achieved. Then we say that the model is trained.
- Save the parameters of the model.
- Feed the testing data into the model to see what comes out; i.e. the predicted output
- Compare the predicted output to the actual output of the testing data to determine the prediction error (or the loss value)
- Come up with a score on how well you did; i.e. the best fit.
- Try other algorithms to see if you scored better.
Suppose for example, your data has two columns: height and weight; and we want to predict the unknown weight of a person given the person's known height. We would then define the input column to be height and the output column to be weight. Then we'd "train" the model and use that to predict the output from the input.
However, one trivial model for illustration is to just ignore the input altogether and predict the output to be just the average of the output. So regardless of a person's height, we would always guess the person's weight to be 62 kg for instance. Of course we can do better by taking in account other information about the person, such as the height and sex.
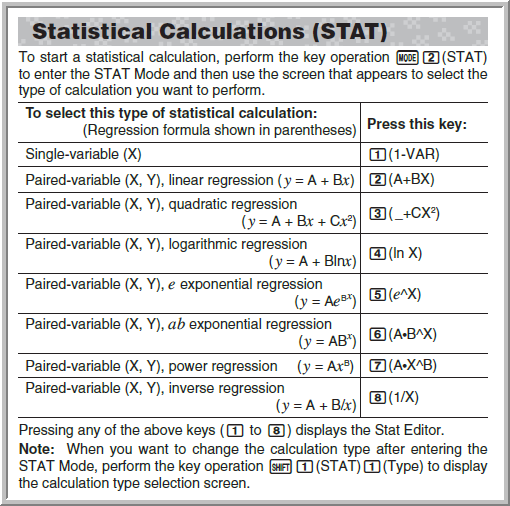
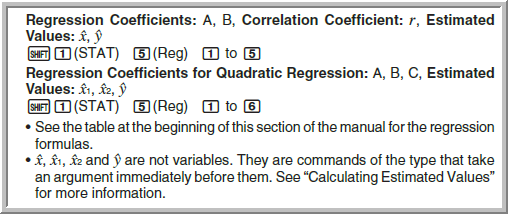
In statistics, a popular model (invented in 1808 before computers) is called Linear Regression. We use the data to calculate the two parameters (Y-intercept and slope) to create a line that best fits the data. We don't really train the model to these two parameters; well, maybe we iterate through the data only one time, which is all that is needed to get the parameters, and maybe this is like training the model. The Least Squared method and the Pearson correlation coefficientare used to determine the best fit score. If this sounds complicated, know that most $15 scientific calculators can do linear regression. Here are some screenshots from the calculator manual that illustrates an old form of finding a model from the data:
As per George Box, "All models are wrong, but some are useful".
Linear Regression is a very simple model, but imagine a model that takes thousands of input values (like pixels from a photo) and returns the category of what is in the picture. This model is too complicated for humans to create, or even understand. But
Machine Learning (ML) is about algorithms that train a complex model (to create it from scratch) using data. It is very much described with math.
General Strategy
To train a model, these general steps are used below.
Import required libraries
Read in the dataset
Contains the input and output data for supervised learning.
Partition data columns into input and output
- Only you can decide which is input and output.
- Output columns are the ones you want to ask questions about.
- Given this new input, predict the output.
Partition data rows into training and testing data
Split the dataset into 75% random columns for testing and the remaining 25% for testing
Scale the input data
If you can linearly scale the data so that it's between -1 and 1, your NN will work better.
Pick the model type
You'll draw upon the wisdom of others to decide this.
Train the model on the training data
Pass through all the rows in the training set to train the network. One pass is called an "epoch". For each epoch, use the error (or cost score) to decide how to change the model (e.g. back propagation) by some amount (called the learning rate).
Test the "trained" model on the testing data
For each row in the testing set:
  Use the model to predict the output from the input.
  Score it and see how well you did.
Print reports on how well it worked
There are lots of types of reports, including the "confusion matrix".
Tools and Libraries
TensorFlow
A mature popular machine-learning library.
- Developed by Google in 2015.
- The 1.x version created "static" graphs.
- The 2.x version introduced "eager" mode for immediate evaluation of operations, making it feel more like PyTorch.
- It provides the XLA optimizing compiler for speed, which is particularly effective on GPUs and Google’s TPUs.
Keras
Adds very convenient wrapper classes to TensorFlow to make it easier to use.
- Created by Francois Chollet (a Google engineer) in 2015
- Version 2.3 (and before) - included many backends
- Version 2.4 - only TensorFlow was supported
- Version 3.0 (and above)- Adds support for JAX and PyTorch too.
PyTorch
- Developed by Facebook in 2016
- PyTorch builds up a graph during the forward pass, and gradients during the backward pass.
JAX
JAX is a Python library designed for high-performance numerical computing, and known as "Composable transformations of Python+NumPy programs: differentiate, vectorize, JIT to GPU/TPU, and more."
- Created by Google in 2022
- "Allows the user to express their computation as a Python function, and by transforming it with grad() gives the gradient function that can be evaluated like the computation function — but instead of the output, it gives the gradient of the output for the first parameter that the function took as input." *